

QA portfolio dashboard across every project
One table over every project – pass rate, active runs, open defects, automation coverage, next milestone – with rules you set.
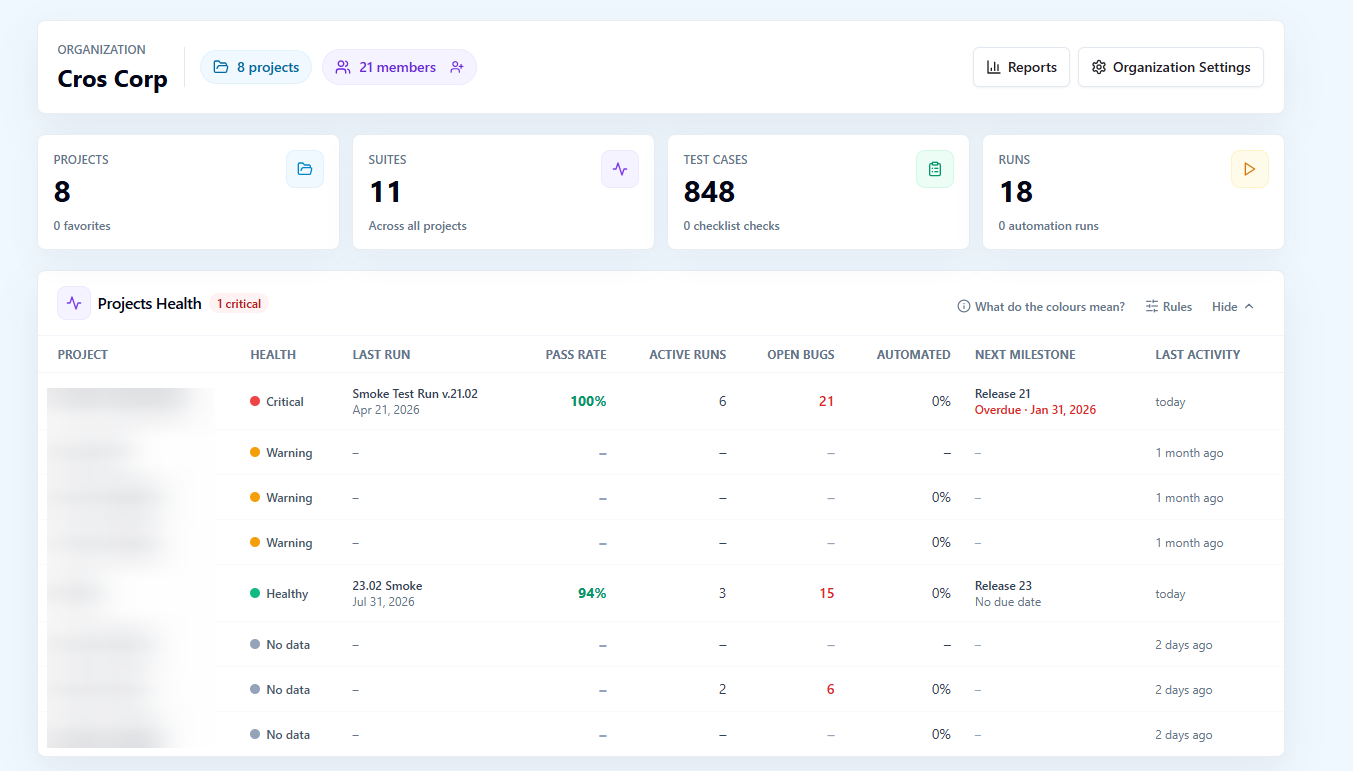
A project dashboard answers "how is this project doing". The question a QA lead, a head of engineering or an agency account manager asks is different: of the twelve projects I am responsible for, which ones need me today. Projects Health is that QA portfolio dashboard, one table on Org Home over every project you can see, with a verdict per project decided by rules your organization writes and can read back as plain sentences.
What the QA portfolio dashboard shows per project
Each project is one row. The columns are the handful of numbers that predict trouble, drawn from the real activity of the project rather than from a status someone typed in.
| Column | What it shows |
|---|---|
| Health | The verdict: Critical, Warning, Healthy or No data |
| Last run | The most recent run in the project |
| Pass rate | The pass rate of the last N completed runs, checklist runs included |
| Active runs | Runs that are open right now |
| Open bugs | Issues raised from testing in this project that are still open in the tracker |
| Automated share | How much of the project is covered by automation |
| Next milestone | The upcoming milestone, flagged when it is overdue |
| Last activity | When someone last did something in the project |
No data is a verdict of its own, not a green by default. A project with no completed runs is shown as such, so a project nobody has tested does not pass as healthy because nothing in it failed.
How a verdict is decided
The verdict is computed from the row's numbers against an organization-wide rule set. Each rule is one check with one severity, warning or critical, and the worst rule that fires decides the color of the row. A project with a falling pass rate and an overdue milestone reads as Critical; one that is merely quiet reads as Warning; one where no rule fires reads as Healthy.
The rules are organization-wide on purpose. A color has to mean the same thing to everyone reading the table, so there is no per-project tuning that lets one team define Healthy more generously than the next. When you tell a stakeholder that three projects are red, every red was judged by the same sentences.
Editing the rules as plain sentences
Organization Admins edit the rules, and each rule reads as a plain sentence with its severity next to it, not as a block of thresholds with abbreviations. The editor is meant to be read by the people the table is for: a lead who wants to know why a project turned red can open the rules and find the sentence that did it.
"What do the colours mean?" opens a legend generated from the live rules. It is not a static help text written when the feature shipped; it is rendered from the rule set in force, so when an admin changes a rule, the legend changes with it and the explanation can never drift from what the table actually applies.
Where the numbers come from
Every column is read from the project's own records, the same ones its reports and dashboard use, so the portfolio view and the project view never disagree.
- The pass rate is taken over the last N completed runs, and completed checklist runs count alongside test runs, so a team that tests mostly with checklists is not shown as untested.
- Open bugs are the issues raised from testing in the project that are still open in the connected tracker, whether they were filed from a failed test execution, a checklist cell or an agent run.
- The automated share tells you how much of the project automation covers, which separates a project that is green because it is well automated from one that is green because nobody has run anything.
- The next milestone comes from the project's milestones, and an overdue one is flagged in the row, so a slipping release is visible before anyone opens the milestone page.
- Last activity is when a person last did something in the project, which is the fastest way to spot a project that has quietly stopped being tested.
Built for the person with many projects
Projects Health sits on Org Home, collapsed by default, and its numbers are loaded on demand when you expand it. Members who open Org Home to get to their own project do not pay for a portfolio-wide calculation they did not ask for, and the person who wants the overview expands it once and reads every project in one table. The table covers the projects you have access to, so a viewer seat for a stakeholder shows exactly the portfolio that stakeholder is allowed to see.
From the portfolio to the project
The table is the starting point, not the destination. A red row leads into the project's own QA dashboard, where the pass rate trend, the execution status of active runs, the active milestone burndown and the recent runs explain what the verdict summarized. From there, the project's reports give the full picture: the Manual Runs and Automation Runs reports behind the pass rate, the Defects report behind the open bugs, and the Automation Coverage report behind the automated share.
In the other direction, the table is how a weekly review stays short. Instead of opening ten dashboards, a lead reads one table, follows the two rows that are not Healthy, and leaves the rest alone.
Who it is for
| Role | What the table answers |
|---|---|
| QA lead over several teams | Which projects need attention this week, and why, in one read |
| Head of engineering | Whether testing is keeping up with delivery across the portfolio, without reading individual reports |
| Agency or consultancy account manager | Which client projects are at risk before the client asks |
| Release manager | Which projects have an overdue milestone or open bugs against the next one |
Plans
Projects Health is part of the Standard and Advanced plans.
Frequently asked questions
What decides whether a project is Critical, Warning or Healthy?
An organization-wide rule set. Each rule is one check with a severity of warning or critical, and the worst rule that fires decides the verdict. A project with no completed runs is shown as No data rather than Healthy. Organization Admins edit the rules, and "What do the colours mean?" shows a legend generated from the rules in force.
Can each project have its own health rules?
No. The rules are organization-wide by design, so that a color means the same thing on every row for everyone reading the table. Organization Admins change them for the whole organization, and the legend updates with them.
Do checklist runs count toward a project's pass rate?
Yes. The pass rate is taken over the last N completed runs of the project, and completed checklist runs are included alongside test runs, so a project that tests with checklists is judged on its real results.
Does the table slow down Org Home for everyone?
No. Projects Health is collapsed by default and its numbers are loaded on demand when you expand it, so members who open Org Home to reach their own project do not trigger a portfolio-wide calculation.