

QA dashboard for test management projects
A per-user widget board: pass rate trend, test base growth, case freshness and the active milestone burndown.
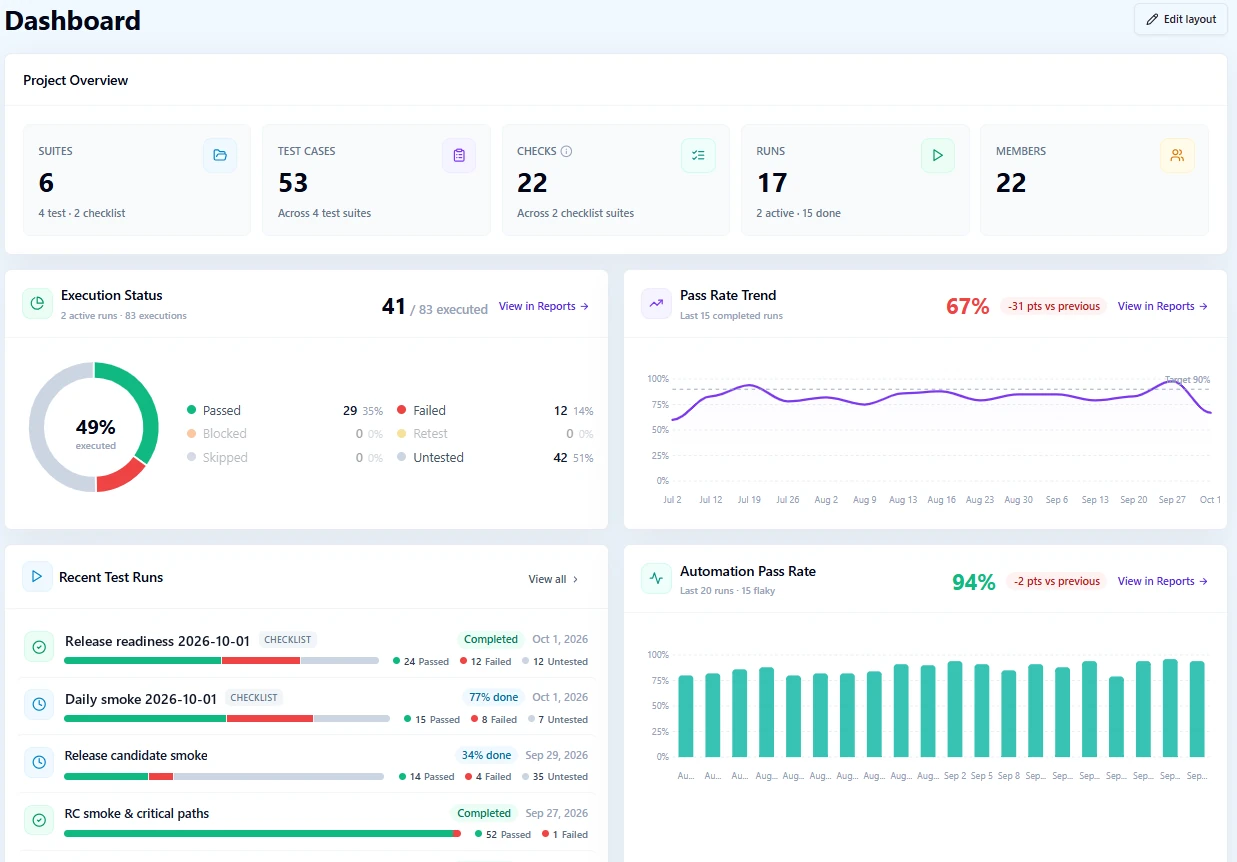
A QA dashboard should answer the morning questions before anyone opens a report: how did the last runs go, is the active release on track, is the suite growing or going stale, and what did the team do yesterday. The QAM Hub project dashboard is a widget board that each person arranges for themselves, reading from the same execution history as the reports, so a number on the board is the number in the report behind it.
A QA dashboard each person arranges
The dashboard is arranged by the person looking at it, not dictated by the tool. "Edit layout" lets you drag widgets into the order you care about and hide the ones you do not, in a two-column board. The layout is per user: a QA lead watching release readiness and an engineer watching their own runs get different boards over the same data, and neither rearranges the other's.
What the widgets show
| Widget | What it shows |
|---|---|
| Project Overview | Counts of suites, test cases, checks, runs and members |
| Pass Rate Trend | The pass rate of the last completed runs, a "Target 90%" line and the change versus the previous run |
| Test Base Growth | Test cases and checks per week |
| Execution Status | A donut of statuses over the active runs |
| Automation Pass Rate | The last 20 automation runs and the flaky count |
| Test Case Freshness | How many cases were never executed and how many are stale, meaning not executed for over 90 days |
| Active Milestone | The burndown and the forecast of the active milestone |
| Recent Test Runs | The latest test runs with their progress |
| Recent Automation Runs | The latest Playwright, Cypress and JUnit XML runs |
| Team Activity | Who did what over the last 30 days |
| Pinned Reports | Saved reports pinned from the Reports page, with their key numbers |
Every widget carries a "View in Reports" link that opens the report behind it with the same scope, so the board is the entry point and the report is the detail.
Pass rate trend: the test pass rate over your last runs
Pass Rate Trend plots the pass rate of the last completed runs, draws a "Target 90%" line through the chart and states the change versus the previous run. Only completed runs are plotted, so a run that is half executed does not pull the line down. The rate itself follows the same rule as the manual reports: Untested and Skipped are excluded from the denominator, so the trend describes what was tested, not how far the team got.
Test base growth and test case freshness
Two widgets describe the suite rather than the runs. Test Base Growth shows test cases and checks per week, so you see whether the suite is growing with the product or has stopped. Test Case Freshness splits the suite into cases that were executed recently, cases that are stale because they have not been executed for over 90 days, and cases that were never executed at all. A large never-executed share is the most common sign that a suite was written for an audit and not for testing, and the widget makes it visible before the audit does.
Execution status and the active milestone
Execution Status is a donut over the active runs: how many executions are Untested, Passed, Failed, Blocked, Retest, Skipped or in a custom status right now, across everything that is open. It is the "where are we today" view for a stand-up.
Active Milestone shows the burndown of the active milestone, remaining versus total executions per day replayed from the real execution history, and the forecast derived from the last 7 days of burn rate: "on track", "at risk" or "overdue". The milestones page explains how the burndown is computed and what counts as remaining.
Automation on the same board
Automation Pass Rate covers the last 20 automation runs and shows the flaky count next to the rate, so a green line that is green only because of retries does not go unnoticed. Recent Automation Runs lists the latest runs that arrived from the Playwright and Cypress reporters or from JUnit XML uploads. Manual and automated results sit on one board because the release question is one question.
Recent runs, team activity and pinned reports
Recent Test Runs lists the latest runs with their progress, so you open the one that needs attention from the board. Team Activity shows who did what over the last 30 days, which is the quickest answer to whether the work is spread across the team or resting on one person.
Pinned Reports is where the dashboard meets reporting. A saved report, a reusable setup from the Reports page, can be pinned to the dashboard with its key numbers, so a lead who checks requirement coverage for the next release every week sees the headline number on the board and opens the report only when it moved.
One project on the board, every project in Projects Health
The dashboard is per project. For the view across every project of the organization, with a health verdict per project, the next milestone and the open bugs, Org Home has the Projects Health table. The two are complementary: the dashboard is the daily view of a team, Projects Health is the weekly view of a portfolio.
Plans
The project dashboard is included on every plan.
Frequently asked questions
Is the dashboard layout shared with the whole team?
No. The layout is per user: "Edit layout" lets each person drag widgets into their own order and hide the ones they do not need, in a two-column board. Everyone reads the same project data, so the numbers agree even when the boards look different.
Which runs count in the pass rate trend?
Pass Rate Trend uses the last completed runs of the project, with a "Target 90%" line and the change versus the previous run. Runs that are still open are not plotted, and Untested and Skipped are excluded from the denominator, so an unfinished run never reads as a quality drop.
What does a stale test case mean?
Test Case Freshness counts a case as stale when it has not been executed for over 90 days, and separately counts cases that were never executed at all. The widget shows both shares next to the recently executed cases, so you see how much of the suite is actually in use.
Can I put my own report on the dashboard?
Yes. Save a report from the Reports page and pin it; it appears in the Pinned Reports widget with its key numbers, and "View in Reports" opens the full report. Saved reports are part of the Standard and Advanced plans.
Can I see several projects on one dashboard?
The project dashboard shows one project. For every project of the organization in one table, with a health verdict, the pass rate of the last completed runs, open bugs and the next milestone, use Projects Health on Org Home, which is part of the Standard and Advanced plans.