

Reporting & dashboards
Dashboards are arranged by each person over the same data. Reports answer the questions asked outside the QA team – coverage, traceability, release readiness, defects, team activity – and can be scheduled, exported and compared across projects.
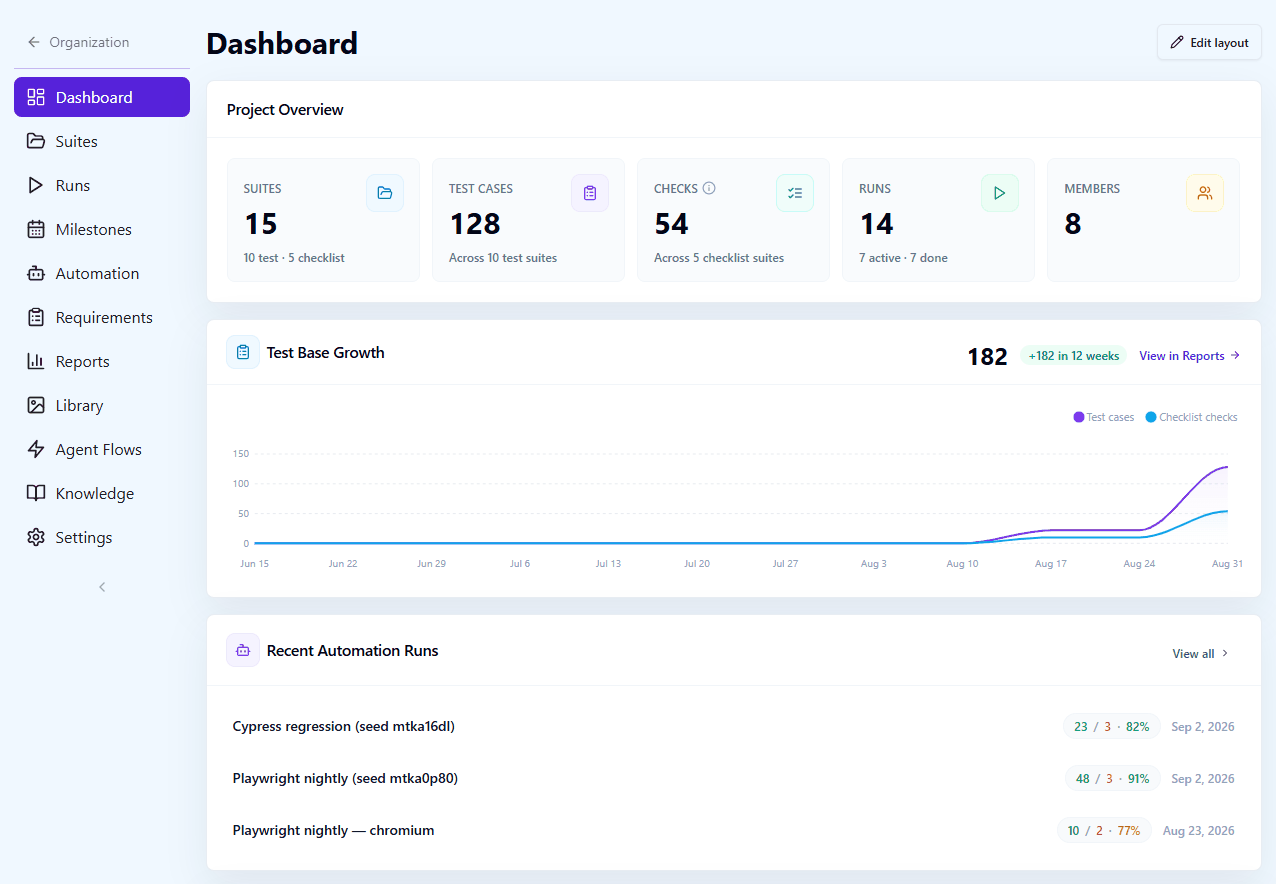
Project dashboard
A per-user widget board: pass rate trend, test base growth, case freshness and the active milestone burndown.
The dashboard is arranged by each person, not dictated by the tool: drag widgets into the order you care about and hide the ones you do not. A QA lead watching release readiness and an engineer watching their own runs get different boards over the same data.
Trend widgets read from real history – cumulative case and check growth per week, the pass rate of recent completed runs, and how much of the suite has never been executed or has gone stale.
- Drag-to-arrange widgets, per user
- Pass rate trend, test base growth, test case freshness
- Active milestone burndown with a forecast
- Recent runs, automation trends and team activity
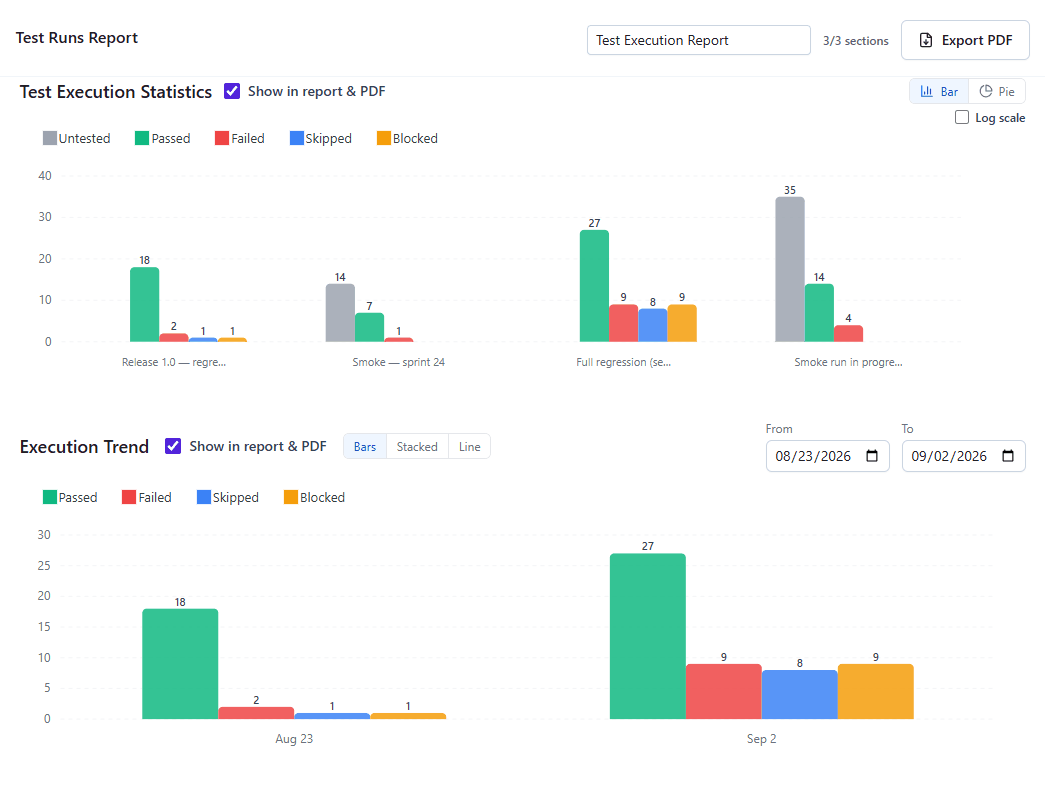
Reports & exports
10+ report types – coverage, traceability, release readiness, defects, team activity – with PDF and CSV export.
Reports answer the questions asked outside the QA team. Coverage and traceability show what is tested and what is not. Release readiness turns a milestone into a go or no-go picture. Defects lists what testing actually found, including issues raised from checklist cells. Team activity shows who did what in a period.
A report setup can be saved and reused, runs can be compared, and any report exports to PDF or CSV for the people who will never log in.
- Coverage, traceability, release readiness, defects, team activity and more
- Saved report setups, and run-to-run comparison
- PDF and CSV export
- Organization-wide reports across every project
Scheduled email reports
Have a report built and emailed on a schedule, so a status update stops being somebody’s recurring task.
Pin a report configuration, choose a cadence and a recipient list, and QAM Hub renders and sends it – the same numbers the dashboard shows, without anyone assembling a Monday-morning summary by hand.
Scheduled reports respect the scope they were configured with, including whether checklists are part of the picture, so a checklist-driven team is not emailed test-run numbers that mean nothing to it.
- Scheduled delivery of any saved report
- Recipient lists that do not require an account
- Snapshots kept, so a delivered report can be re-read
- Scope-aware: checklist teams get checklist numbers
Cross-project health
One table over every project – pass rate, active runs, open defects, automation coverage, next milestone – with rules you set.
For anyone responsible for more than one project, the useful view is comparative: which projects are healthy, which need attention, and which are in trouble. The health panel derives that verdict from real metrics and an organization-wide rule set.
The rules are yours to edit, and they are organization-wide on purpose – a colour has to mean the same thing to everyone reading the table. The legend is generated from the active rules, so the explanation can never drift from what is actually applied.
- Critical, warning and healthy verdicts per project
- Editable, organization-wide threshold rules
- A legend generated from the live rules
- Pass rate, active runs, open issues, coverage, next milestone, last activity