Automation Coverage Reporting
Once your automated runs are flowing into QAM Hub, the Test Explorer and automation reports tell you whether your automation is green, trustworthy, and actually covering the cases you care about. This guide explains what each view shows and how to read it.
To get runs in first, see uploading Playwright reports or uploading Cypress reports.
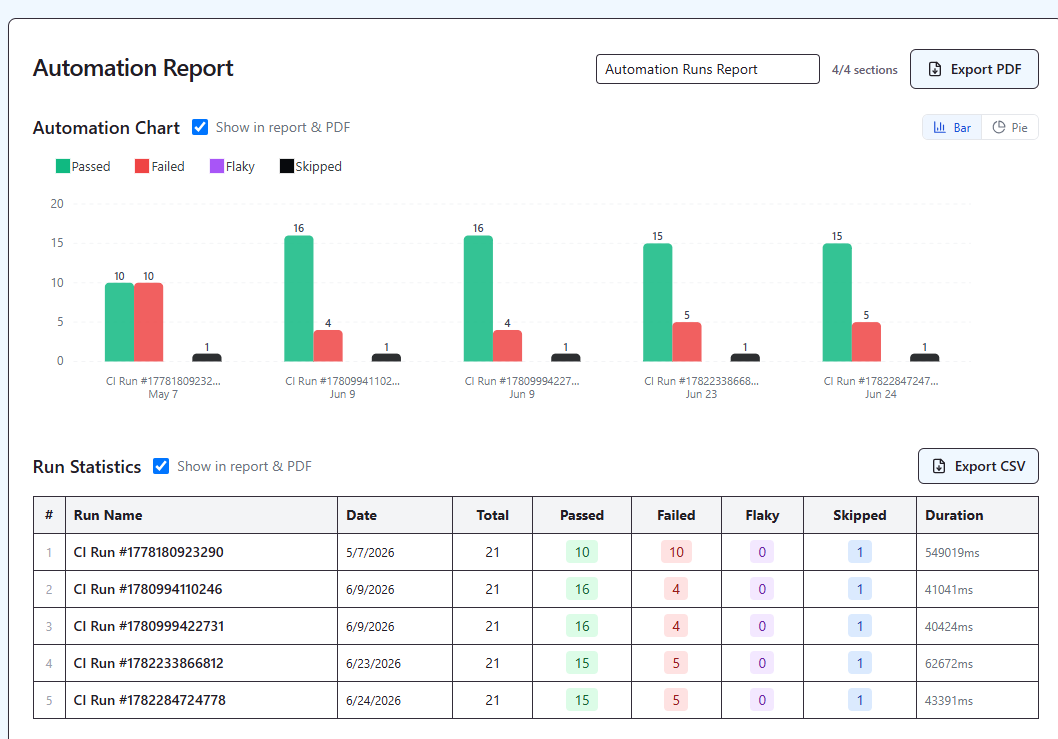
Run-level view
Each run shows a summary — pass / fail / skipped / flaky counts and total duration — and per-test detail with status, error and stack trace, retries, and failure screenshots. This is the "what happened in this run" view.
Health over time: Test Explorer
The Test Explorer is the analytics view across runs. For your suite it shows:
- Pass rate — how often tests pass.
- Flakiness rate — how often tests need a retry to pass.
- Stability score — an overall measure of how dependable the suite is.
- Average duration — how long tests take.
- Trend sparklines — these metrics over a 7–90 day window, so you can see whether things are improving or degrading.
Cross-run intelligence
QAM Hub automatically surfaces patterns you'd otherwise hunt for by hand:
- Regressions — tests that passed last run and are failing now.
- Chronic failures — tests failing every run.
- Top failing tests — your worst offenders, ranked.
- Flakiness per run — how unstable each run was.
What you can do with it
- Drill into any test for a run-by-run timeline, duration trend, and grouped "top failure reasons."
- Quarantine flaky tests (admins) so unstable tests stop polluting your health metrics.
- Filter and slice by suite, framework, branch, or environment to focus on what matters.
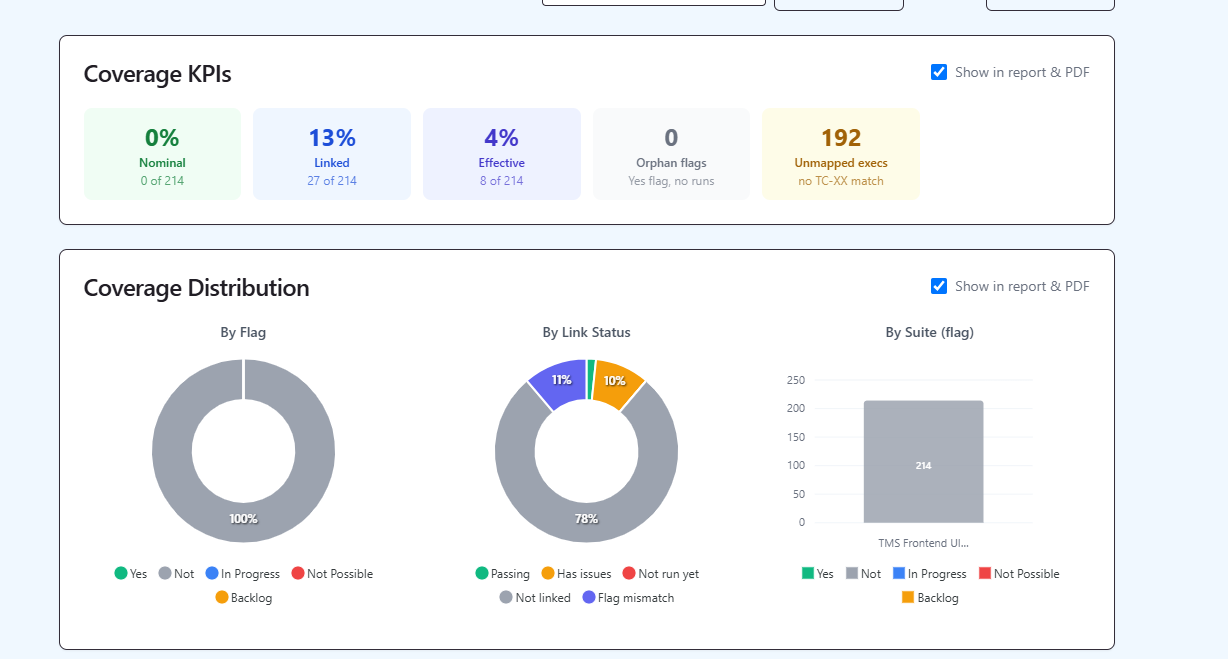
Coverage: manual vs automated
The automation coverage report answers the question raw run results can't: how much of your test base is actually covered by automation versus still done manually. Because automated results link back to manual cases via the TC-<number> convention, you can trace coverage straight from a manual case to its automated execution history — and see, honestly, where automation ends and manual testing begins. This is especially useful during the transition from manual to automation.